Most published PPC benchmarks come from US averages or global aggregates that paper over real Canadian-market variance. We aggregated CPC and conversion-rate data across member agencies' Canadian client portfolios for the past two quarters — roughly 200 active accounts — and the picture is meaningfully different from what marketers planning Canadian budgets typically reference.
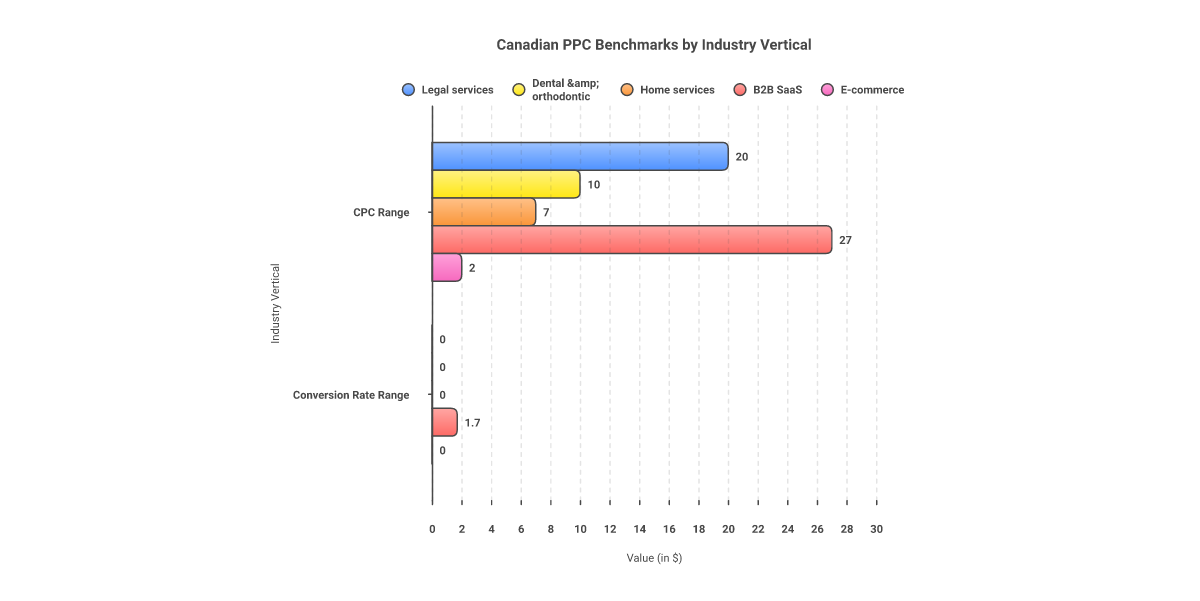
CPCs by vertical (CAD, Google Search, Canadian geo)
- Legal services: $12 to $28 per click depending on practice area. Personal injury and class action are at the top; immigration and family law mid-range; estate planning at the lower end.
- Dental and orthodontic: $6 to $14 per click in major metros, $3 to $7 in smaller markets.
- Home services: $4 to $11 per click depending on competition density. Plumbing and HVAC trend higher; lawn care and cleaning at the lower end.
- B2B SaaS: Extreme variance, $8 to $35 per click for category terms. The high end is dominated by sub-categories where US-trained ad accounts compete in Canadian auctions.
- E-commerce non-brand: $1 to $3 per click on average, skewing up sharply during BFCM and other peak windows.

Conversion rates that we actually see
Service businesses (legal, dental, home services) typically see 1.5 to 4 percent conversion rates from search-ad clicks to leads, with strong landing-page work pushing the upper end. B2B SaaS lead capture sits at 0.8 to 2.5 percent for cold traffic on category terms. E-commerce conversion rates vary the most, 0.5 to 4.5 percent depending on AOV, brand strength, and free-shipping threshold positioning. Mobile conversion rates lag desktop by 25 to 40 percent in most verticals — relevant in Canada where mobile traffic share is high.
What moves these numbers
Geo-tightening from province-level to metro-level cuts auction noise and typically reduces effective CPC. Value-based bidding tied to CRM-uploaded conversion values outperforms bid-by-conversion-count, especially in B2B. Negative-keyword discipline is the single most-neglected lever in the audits we run; aggressive negatives still show 15 to 25 percent improvement in qualified-lead rate in untouched accounts. Performance Max performs unevenly — protected exact-match search campaigns continue to beat all-in PMax for most service-business advertisers we observe.
Caveats on the numbers
These are observed averages from member-agency portfolios, not statistically-rigorous market-wide measurements. Industry-published benchmarks like the WordStream Google Ads benchmark report and similar provide adjacent reference points, though they're typically US-centric and don't break down Canadian markets. Treat our numbers as directional. Member agencies pricing client retainers should benchmark against actual same-vertical Canadian accounts when available, in alignment with our Honest Representation standard on outcome expectations.
Published by CanadianInternetMarketingAssociation.com, 10 May 2026. Benchmarks are aggregated observations from member-agency client portfolios; specific accounts vary widely.
Keep reading
Browse the full blog index, jump to our resources, or look up terms in the glossary.