Core Web Vitals are a ranking factor and a real conversion lever, and Canadian sites tend to score worse than US-based equivalents for reasons that are partly geography and partly habit. We pulled aggregate data from member-agency client portfolios alongside Chrome User Experience Report (CrUX) data — the picture has clear patterns and clear fixes.
The thresholds, briefly
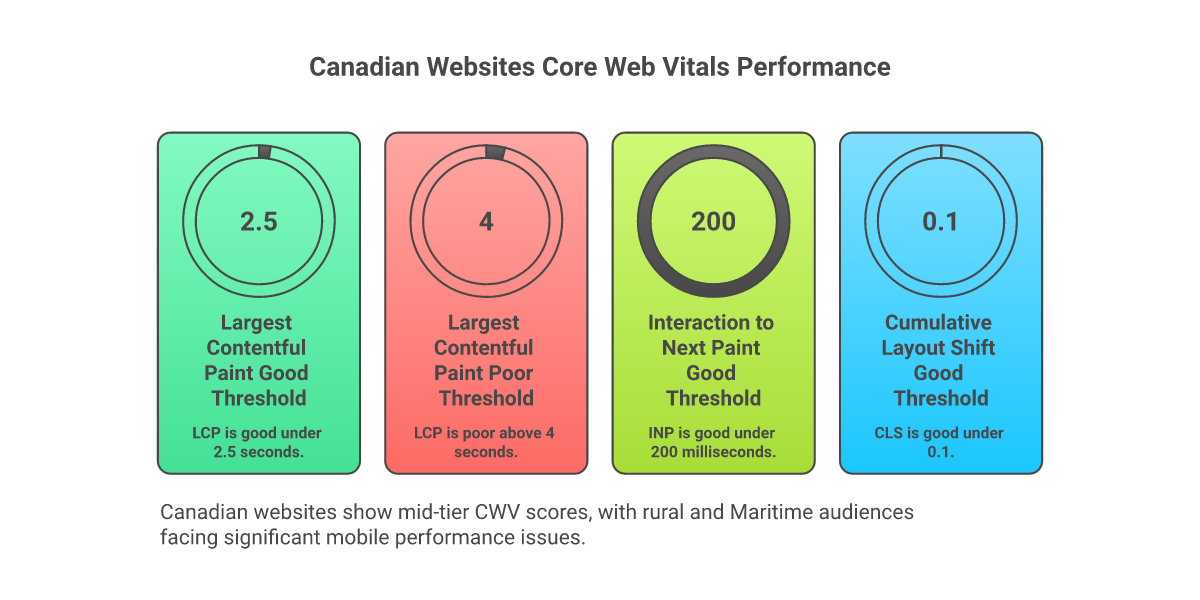
- Largest Contentful Paint (LCP): Good ≤ 2.5s, Poor > 4.0s. Measures when the largest above-the-fold element renders.
- Interaction to Next Paint (INP): Good ≤ 200ms, Poor > 500ms. Replaced FID. Measures responsiveness across all user interactions.
- Cumulative Layout Shift (CLS): Good ≤ 0.1, Poor > 0.25. Measures unexpected layout movement.
Google's Core Web Vitals reference is the authoritative source.
Where Canadian sites score worse
The CrUX data shows Canadian rural, Maritime, and Northern audiences experiencing materially worse mobile performance than urban audiences in major metros. This is partly network conditions — slower last-mile connectivity in less-dense regions — and partly device skew toward older Android phones. Sites that look fast on a Toronto agency MacBook over fibre routinely fail Vitals on a five-year-old Samsung in Pemberton on weak 4G. The audit fix: test on real devices and throttled connections, not just Chrome DevTools idealized profiles.

The recurring failure points
Across roughly 60 Canadian sites we've audited recently, the same handful of issues account for most failed Vitals scores. Hero images that aren't sized, compressed, or served in modern formats. Third-party scripts (chat widgets, analytics tags, social embeds) blocking main-thread work. Late-loading web fonts causing CLS. Programmatic ad placements without reserved-space CSS. These are all fixable in the day-to-day rather than in a months-long replatform — most sites we audit recover materially within four to six weeks of focused work.
What to fix first
In our prioritization framework, the order is: optimize LCP element first (compression, format, sizing, preload hints), then audit INP-blocking JavaScript with the Chrome DevTools Performance panel, then resolve CLS with explicit dimensions on images and reserved space for late-loaded content. LCP fixes typically deliver the biggest visible improvements per hour spent. INP fixes are subtler but compound across all user interactions.
The honest reporting approach
CrUX data is the field measurement Google actually uses for ranking — synthetic Lighthouse scores are useful for development but not authoritative for ranking. Report client Vitals from CrUX or Search Console's Core Web Vitals report, not from one-off Lighthouse runs that may not reflect real-user experience. This aligns with our Honest Representation standard on outcome reporting.
Published by CanadianInternetMarketingAssociation.com, 10 May 2026. Findings reflect aggregate observations across Canadian agencies; specific site results vary widely.
Keep reading
Browse the full blog index, jump to our resources, or look up terms in the glossary.